NACH OBEN

Wind tunnel

Contact: Dr.-Ing. Maximilian Paßmann, Artem Tukalov

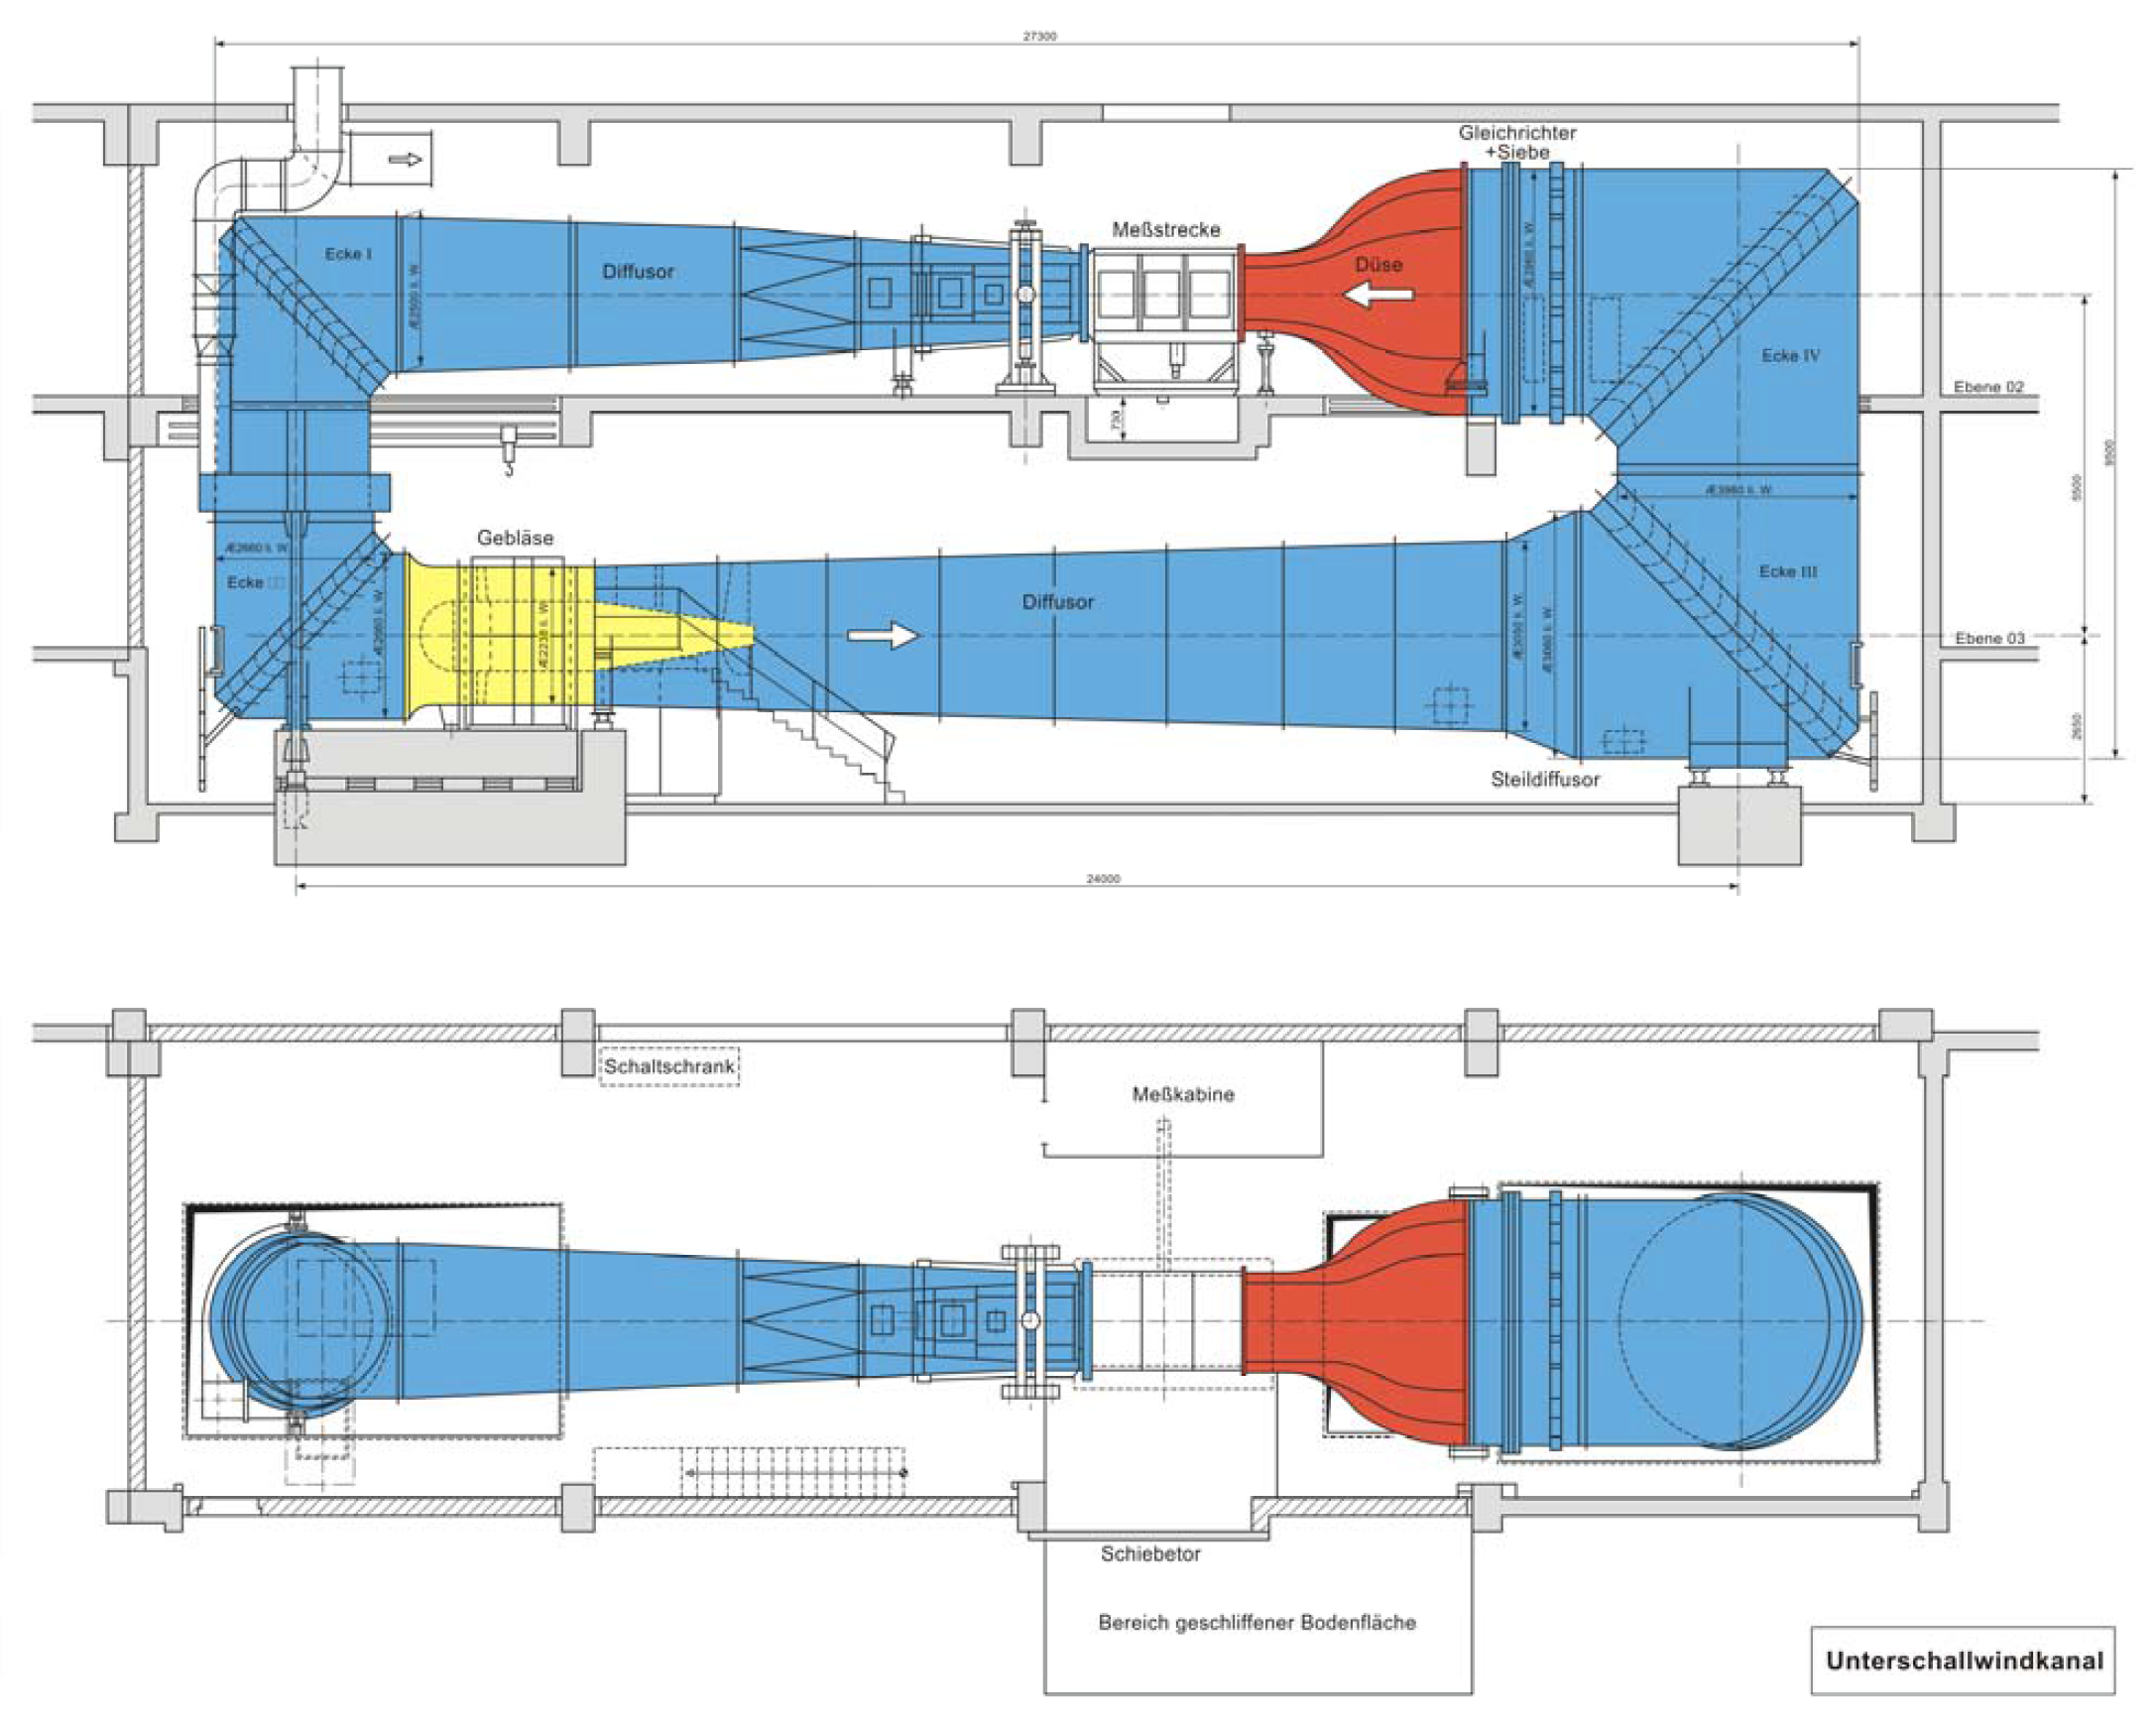
For teaching and research purposes, the chair has a subsonic wind tunnel (incompressible) of Göttingen design (see Fig 1). The facility can be operated with both an open and closed test section. The test section volume of 1.5 m x 1.2 m x 2.5 m (W x H x L) allows for the investigation of larger test objects, with a low turbulence intensity of Tu < 0.2%. For studies at higher turbulence intensities, an adjustable turbulence grid is available, which can be mounted at the exit of the contraction.


Available measurement technology:

  • Pneumatic Probe Measurement Technology:
  1. Pitot and Prandtl probes for determining total pressure and flow velocity
  2. Various multi-hole probes (e.g., three- and five-hole probes) for measuring local flow direction and velocity
  3. Probes for investigating boundary layer flows
  • Electromagnetic pressure scanner (Scanivalve) for automated sequential measurement of up to 96 individual pressure signals / measurement points.
  • Data acquisition: National Instruments CompactDAQ with various I/O modules.
  • Optical Measurement Technology:
  1. PIV (planar, stereo) with evaluation via LaVision DaVis or the open-source software PIVlab.
  2. Smoke wire visualization
  3. Visualization of surface streamlines (wall shear stress lines) using the dye method.

Typical test cases:

  • Determination of the drag coefficient Cw
  • Determination of the static wall pressure distribution (e.g., profile pressure distribution for airfoils or blade profiles).
  • Detailed measurement of the inflow and outflow fields of test objects (PIV, multi-hole probes).
  • Measurement of the boundary layer flow on test objects.

Technical data:


Fig 1: Technical drawing of the grid wind tunnel.
Lupe
Fig 1: Technical drawing of the grid wind tunnel.
Fig 2: Test setup from the field of hearing aid acoustics.
Lupe
Fig 2: Test setup from the field of hearing aid acoustics.

Fig 3: Flow visualization on the delta wing (field illumination).
Lupe
Fig 3: Flow visualization on the delta wing (field illumination).

Fig 4: Flow visualization of a counter-rotating vortex pair on the delta wing using laser light sheet at the wing's trailing edge.
Lupe
Fig 4: Flow visualization of a counter-rotating vortex pair on the delta wing using laser light sheet at the wing's trailing edge.